Data-Driven Defect Reduction
Summary
"We're seeing spikes in defective shipments, but we don't know why."
I built a custom, microcontroller-based monitoring device for a freelance client which captured ambient temperature and noise data across varied seasonal and operational conditions. I then built a full data pipeline that ingests, transforms, and analyzes the data to identify correlations between environmental conditions and defect rates during order packing.
- Role — Data pipeline architect, dashboard developer, prototyping engineer, writer, researcher
- Tools — Supabase (PostgreSQL + REST API), Python (pandas, seaborn, matplotlib), Streamlit, CircuitPython (RP2040 Connect), Jupyter
I delivered a complete cloud-connected, sensor-to-dashboard setup featuring physical computing, data engineering, and operational analysis that supports real-world fulfillment insight and experimentation.
This case study reflects the kind of work I do for clients: building lightweight, insight-driven systems that connect real-world behavior to measurable outcomes.
Gallery
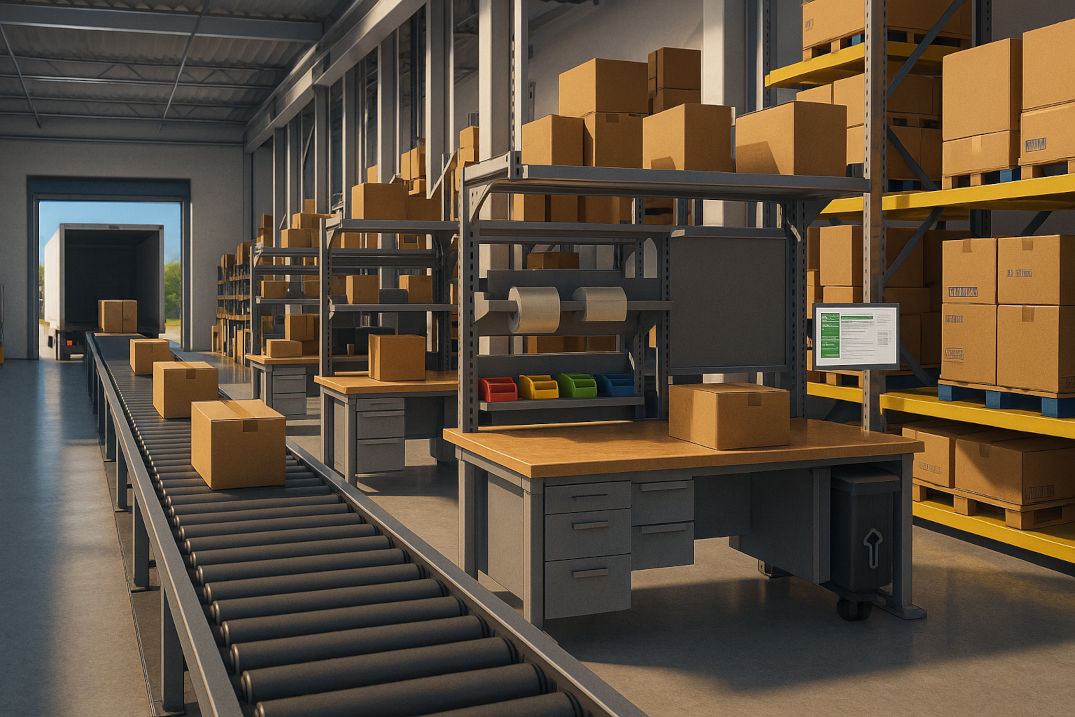
A conceptual layout designed for this scenario, balancing realism with constraints: one sensor node, minimal coverage gaps, and plausible airflow and noise exposure near packing activity.
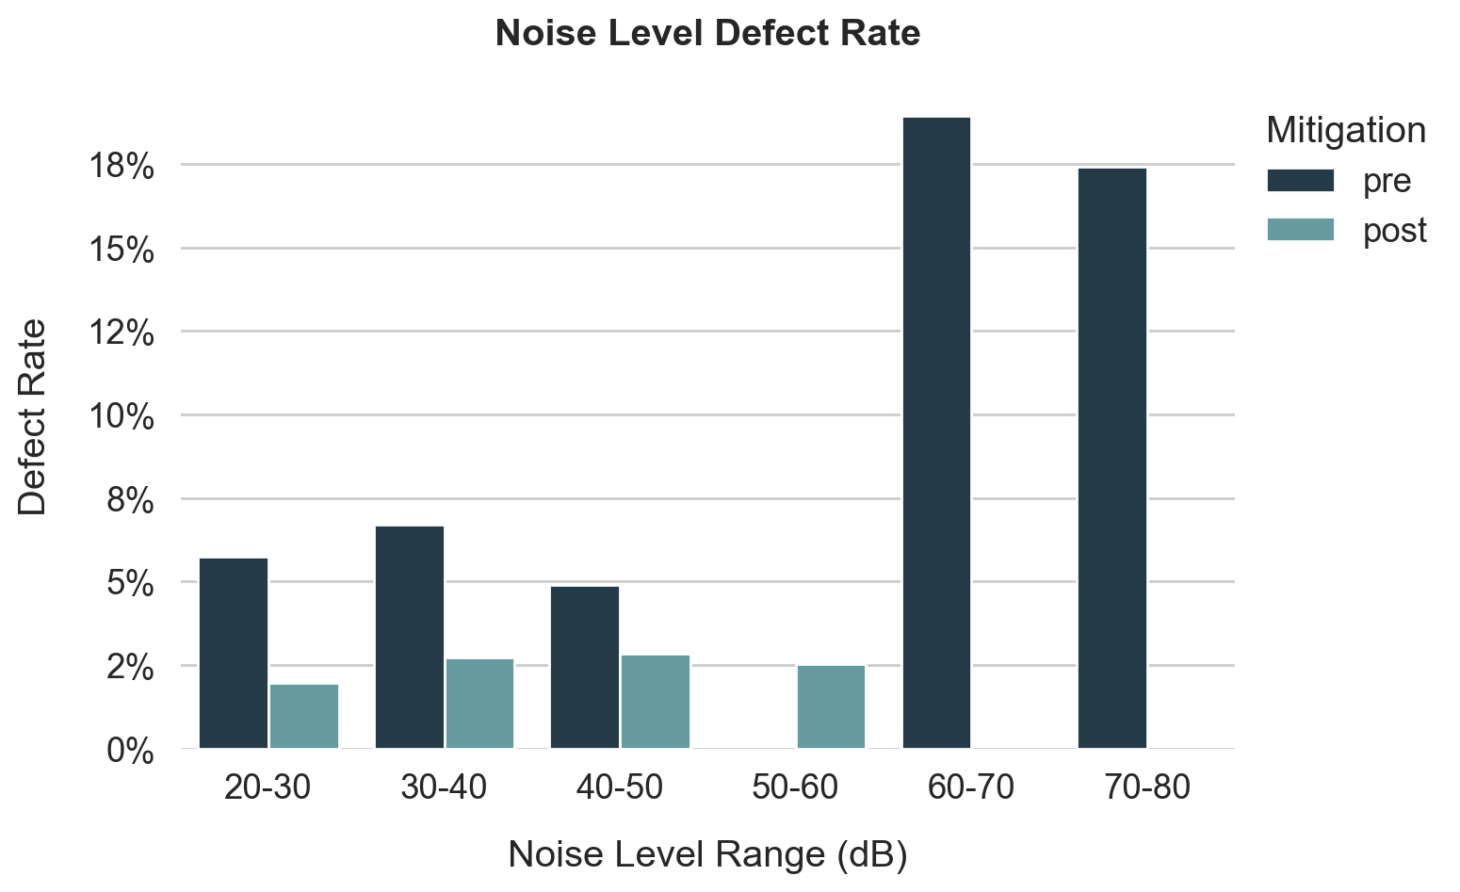
Pre-mitigation analysis revealed a sharp increase in defect rates above 60 dB, highlighting potential disruptions tied to ambient machinery noise.
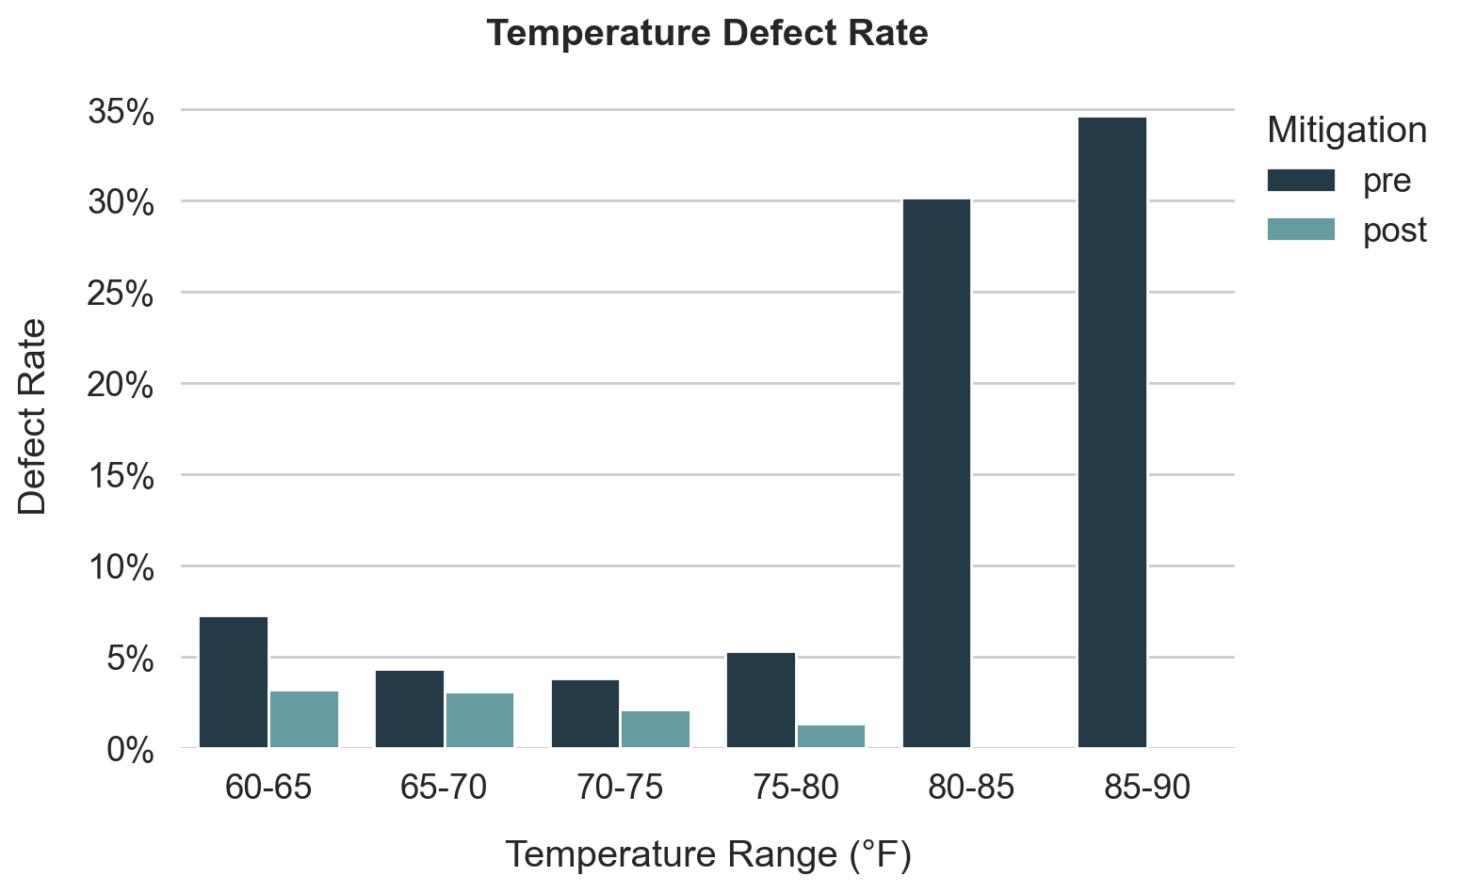
Defect rates increased significantly above 80°F prior to mitigation efforts, suggesting heat stress or other issues in the packing environment.
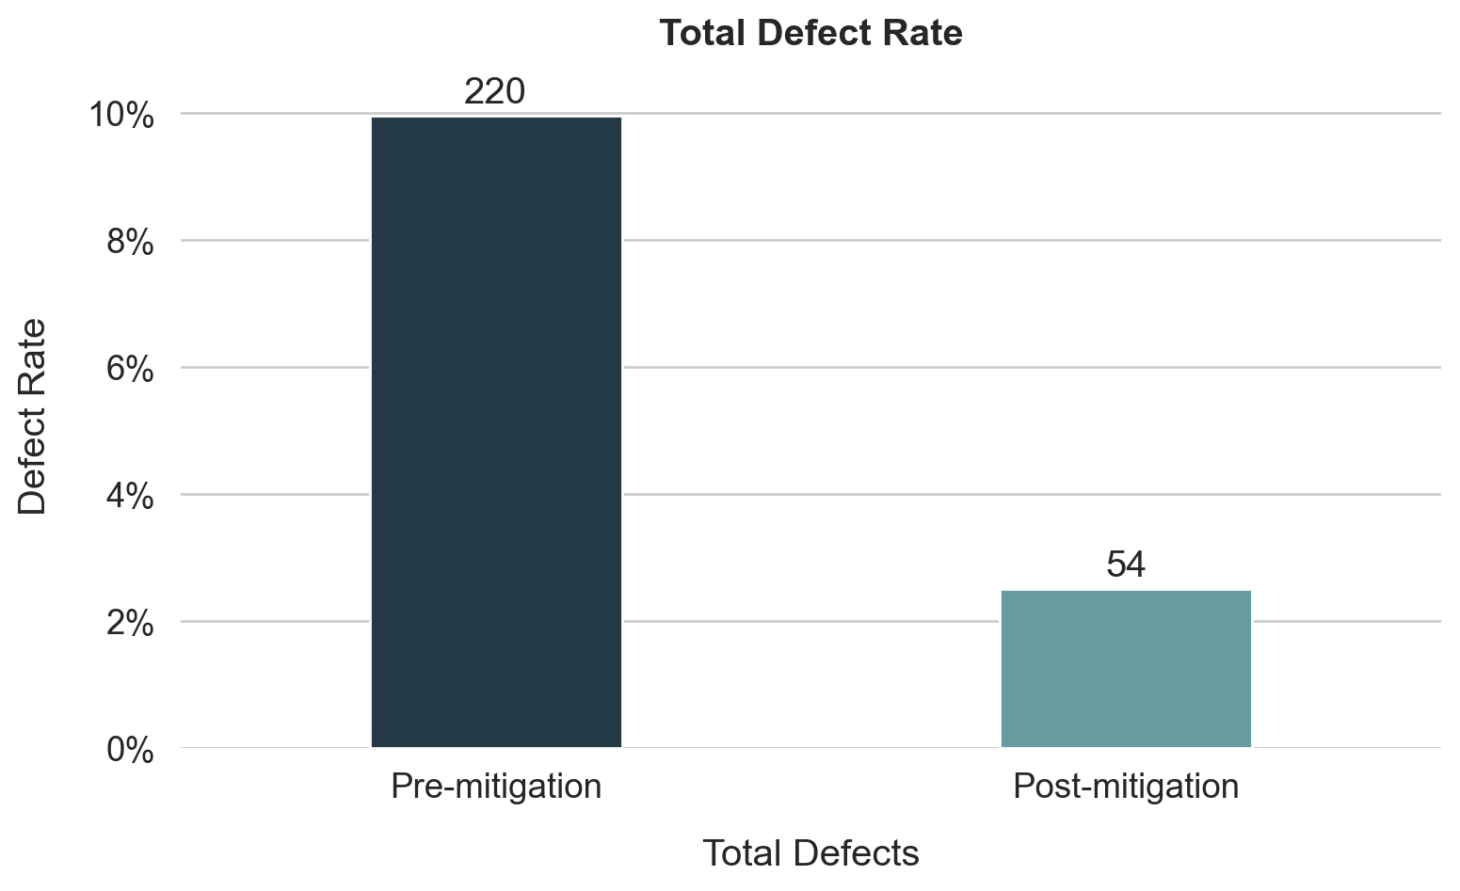
Post-mitigation defect rates dropped by over 75%, confirming the effectiveness of airflow, insulation, and acoustic damping upgrades.

Before mitigation, the highest defect rates appeared where elevated noise and temperature overlapped, reinforcing the case for environmental intervention.
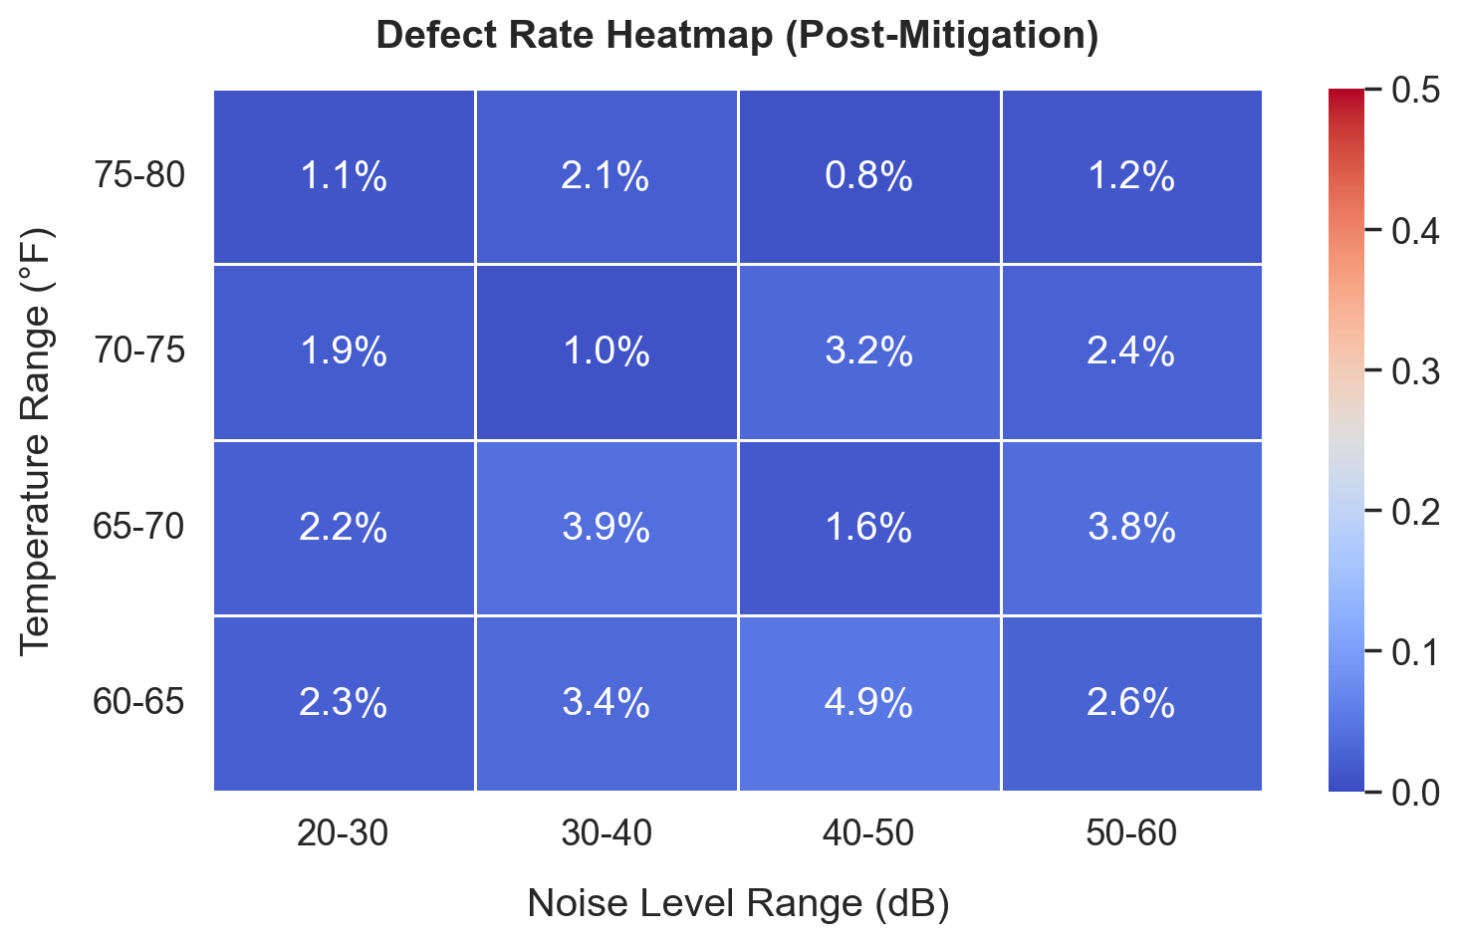
Following interventions, defect rates normalized across temperature and noise ranges, with no concentrated zones of elevated errors.
Click an image for a closer look and more information.
Details
This system performs environmental data collection, takes in fulfillment error tracking, and performs defect correlation reporting using a simple, hardware-to-database-to-dashboard architecture.
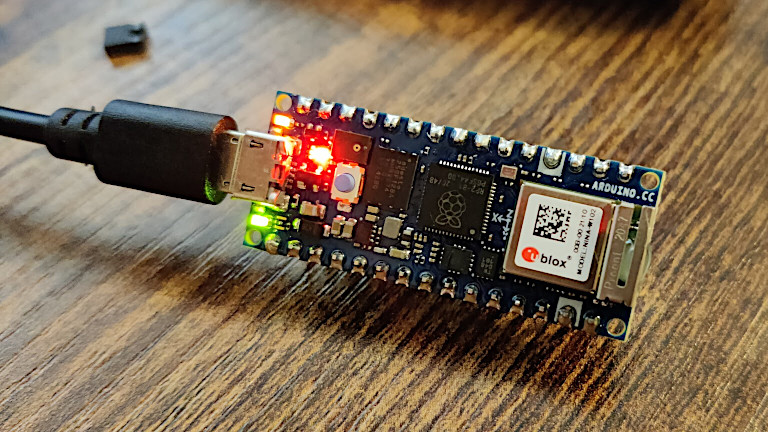
- Microcontroller: RP2040 Connect running CircuitPython, chosen for onboard Wi-Fi, microphone, and temperature sensor
- Mounting: Simulated mounting in the pack area above the conveyor belt, pointed toward the packing station (in reality, no directional sensing required)
- Assumption: One sensor was sufficient given the modest warehouse footprint and layout
- Ambient noise: Modeled from fixed conveyance times (3 times per day), with random baseline ambient noise during off periods
- Database: Supabase PostgreSQL instance
- Ingestion: REST API used to post readings; separate table for operational order data
- Schema Design: Two primary tables:
order_fulfillment_dataandshipdock_environmental_data - Simulated Data: Generated testing data including realistic timestamps, defect types, box sizes, order sizes, shipping delays, etc.
- Correlation Design: Defect probability increased if temperature > 80°F and/or noise > 60 dB
- Binning: Temperature and noise values grouped into ranges for analysis
- Exploration: Conducted groupby aggregations and pivot-based heatmaps using pandas, seaborn, and matplotlib
- Dashboard: Streamlit app with dropdown-selectable views
- Charts: Three bar charts (temperature, noise, total defects) and two heatmaps (pre- and post-intervention)
- Mitigation Split: June-July modeled as baseline; August-September included simulated environmental improvements (fans, AC units, noise dampening curtains)
- A functioning warehouse insight system built from scratch
- Dashboard demonstrates clear visual drop in defect rate post-intervention
- Heatmaps show nuanced interactions between heat, noise, and error frequency
- Clean modular codebase, deployed with synthetic data and ready for adaptation
- Cold Weather Effects: Explore whether colder temperatures increase conveyance noise due to material contraction or lubricant changes
- Additional Sensors: Add humidity, motion, or light sensors for broader context
- More Granular Layout: Map zones of the warehouse to detect localized issues
- Production Integration: Adapt this prototype to push data to real-time ops dashboards or alerts
- Long-Term Mitigation: Consider warehouse-wide HVAC or reorganization for structural improvements
- Employee Feedback Loops: Use formal UX research techniques to survey workers and analyze responses, validate environmental impact, uncover overlooked issues, and inform future design
- An independent freelance project can still deliver real, actionable value when rooted in authentic experience
- Simulated data, when built with care, is a powerful tool for pre-testing hypothesis and demonstrating technical breadth
- Simple tools like Supabase, Streamlit, and Matplotlib/Seaborn are enough to tell compelling operational stories
- Engineering curiosity paired with UX empathy can yield credible solutions in complex logistics environments